Challenge
The problem behind the build
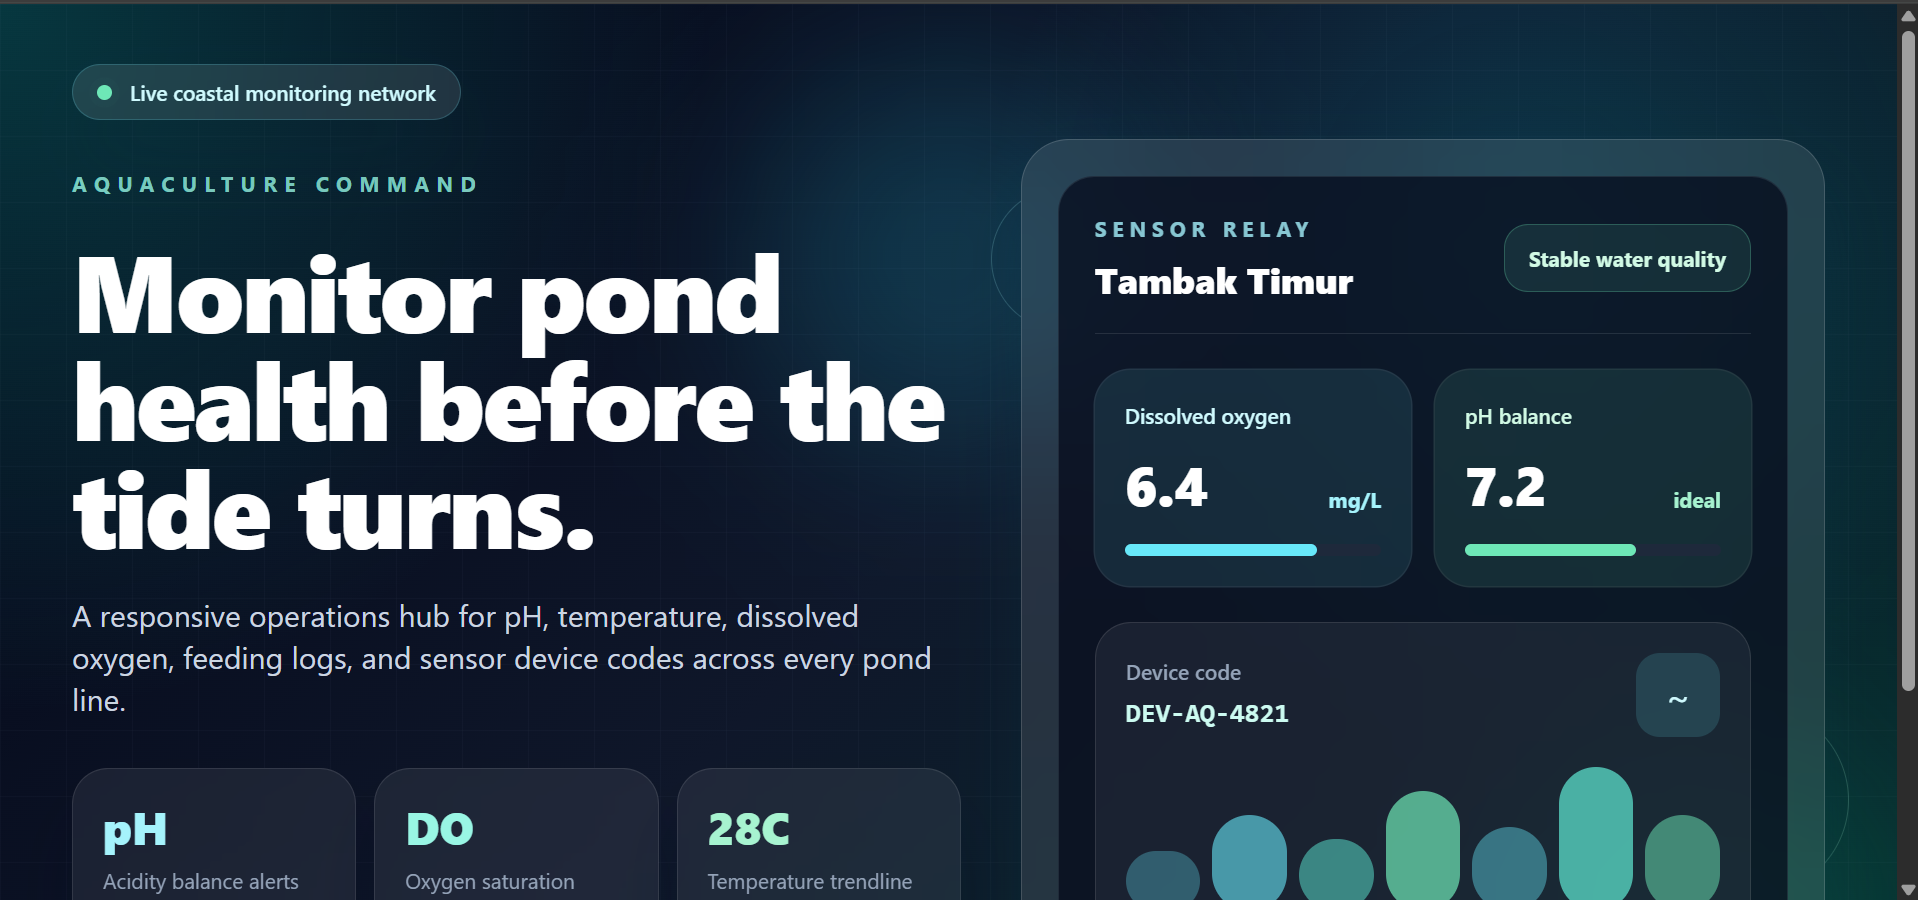
Water quality data needed to be monitored and interpreted more consistently so operators could respond to pond condition changes sooner.
Client
Aquaculture research team
Industry
Aquaculture & IoT
Timeline
6-8 weeks
Role
Dashboard design, web platform, API integration
Challenge
Water quality data needed to be monitored and interpreted more consistently so operators could respond to pond condition changes sooner.
Solution
We developed a web dashboard that organizes sensor readings, pond records, and user roles into a clear monitoring experience for daily operations.
Product scope
Screens
Outcomes
Connected services
More work
Share the workflow, website, or automation idea you have in mind. We can help turn it into a practical scope.
Discuss a project